Rosie is dedicated to leveraging data to make intelligent business decisions to help our retailer partners grow their in-store and online business. Understanding your customer is crucial to executing a profitable eCommerce program. Are your customers shopping online on their desktop or smartphone? How often are they placing orders and what is their average basket size? This data helps you positively impact your bottom line.
Rosie Data Analytics is a tool available to Professional and Enterprise tier Rosie retailer partners. Rosie Data Analytics allows retailers to securely access eCommerce data 24/7. As a Rosie retailer you can check the temperature of your eCommerce service daily. You can compare this year to last year. You can make the right decisions on marketing, labor, and product mix.
Retailer Live Monthly Metrics
This report is a live daily dashboard of your eCommerce service. We feature several Key Performance Indicators (KPI) at the retailer level. These KPIs include total orders, new user registrations, new user conversions, first-time orders, and total revenue for any given month.
- Total orders per month
- Number of new user registrations per month
- New user conversion and conversion rate per month
- All first-time orders per month
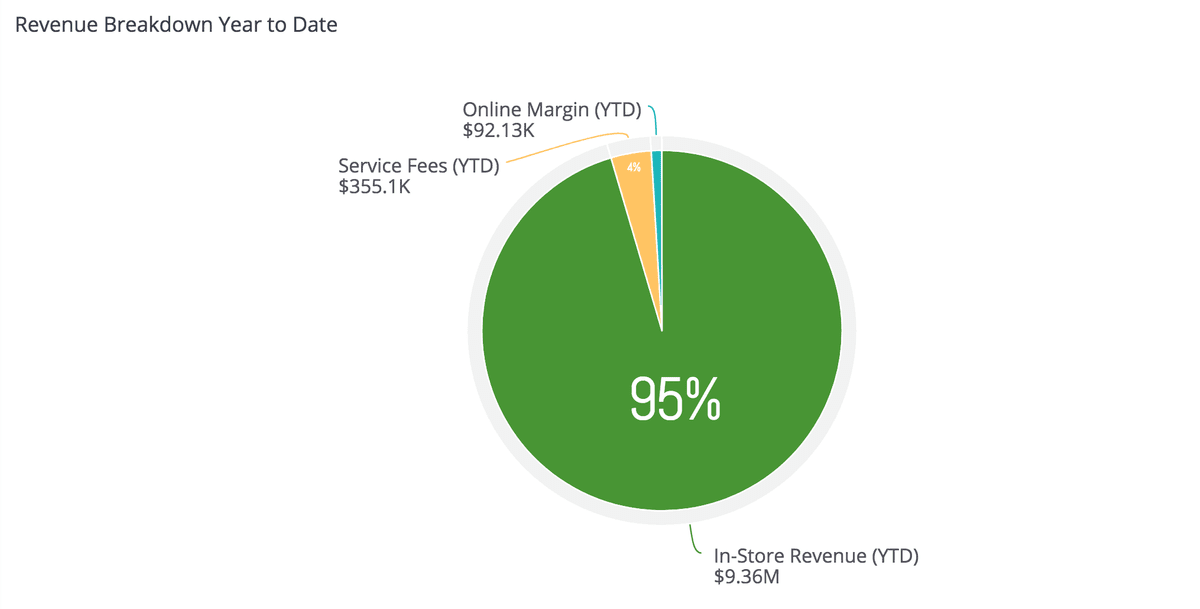
- Total revenue year to month or year to date
- Revenue breakdown for year to date
- Number of active users per store for year to date
- Store stats (active users, total revenue, current orders, etc) for year to date
Store Summary Metrics
This report provides summary-level eCommerce performance and promotion code metrics at the individual store level for selected time periods.
- Total revenue per store for a selected time period
- Number of active users per store for a selected time period
- Total order per store during a selected time period
- Average basket size per store during a selected time period
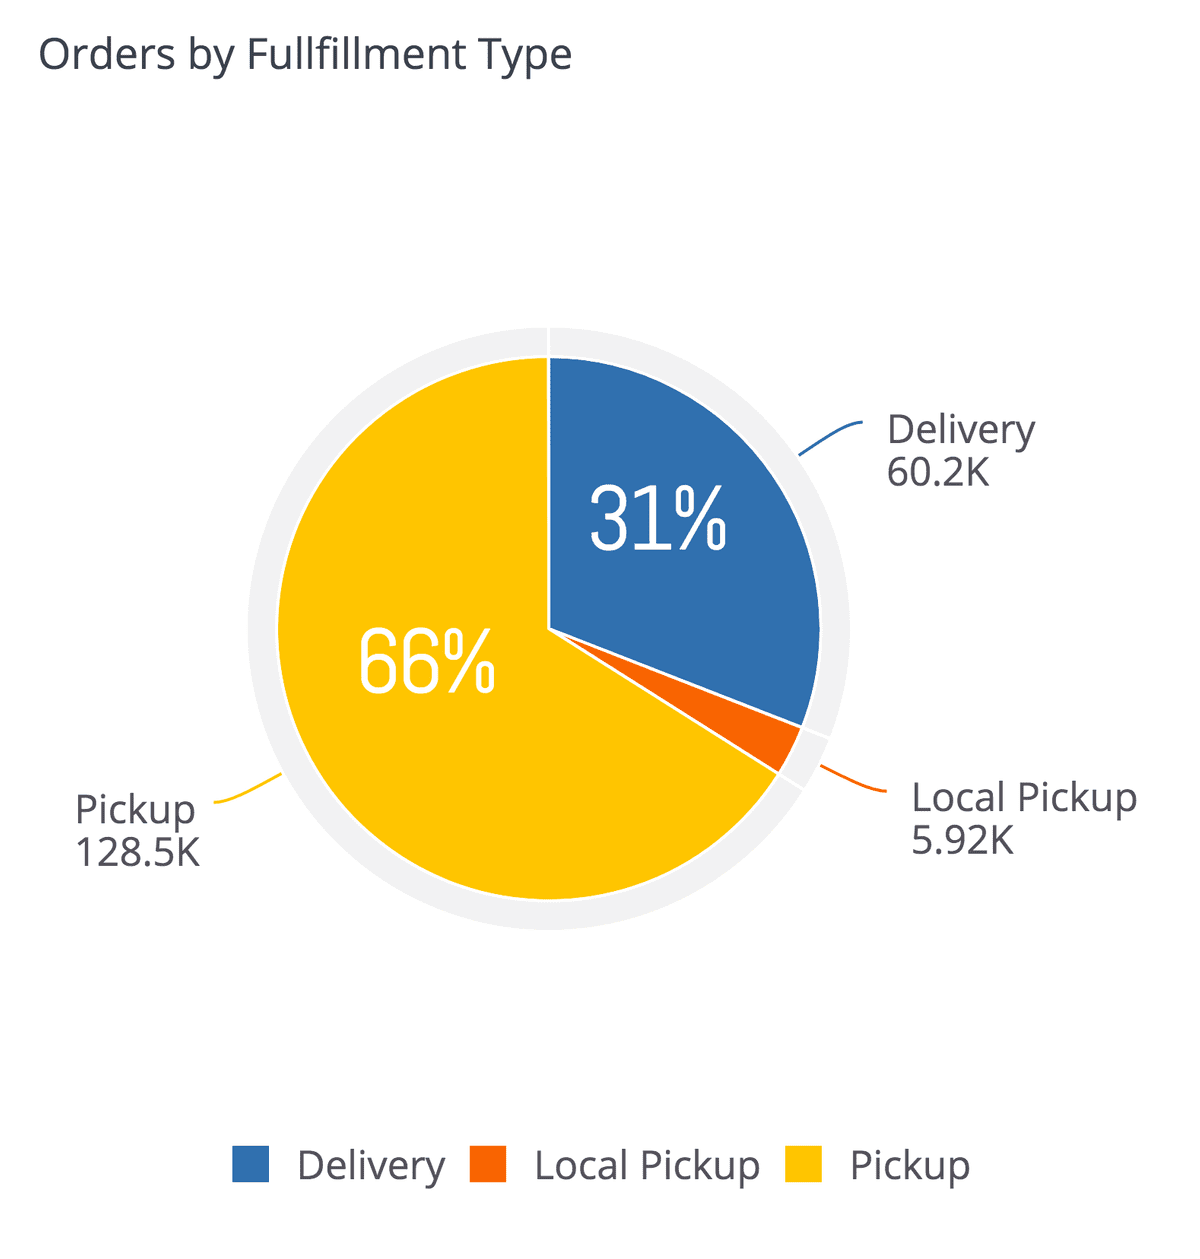
- Order by fulfillment type (delivery, pickup, local pickup) per store during a selected time period
- Total revenue breakdown per store for a selected time period. This includes total in-store revenue (shelf tag price), total online margin revenue and total service fee revenue.
- Monthly active user trends for current and previous years at the selected store(s)
- Order trends (total number of online completed orders) for each calendar month for the current and previous years at the selected store(s)
- Revenue trends (the total dollar value paid by customers online, excluding tax, during the calendar month)
- Monthly active user gender breakdown
- Monthly active user age distribution
- Monthly active user household size distribution
- New vs. repeat monthly active users
- Promotion code usage
- Promotion code usage by new vs. repeat customers
- All promotion codes summary
Platform Usage Metrics
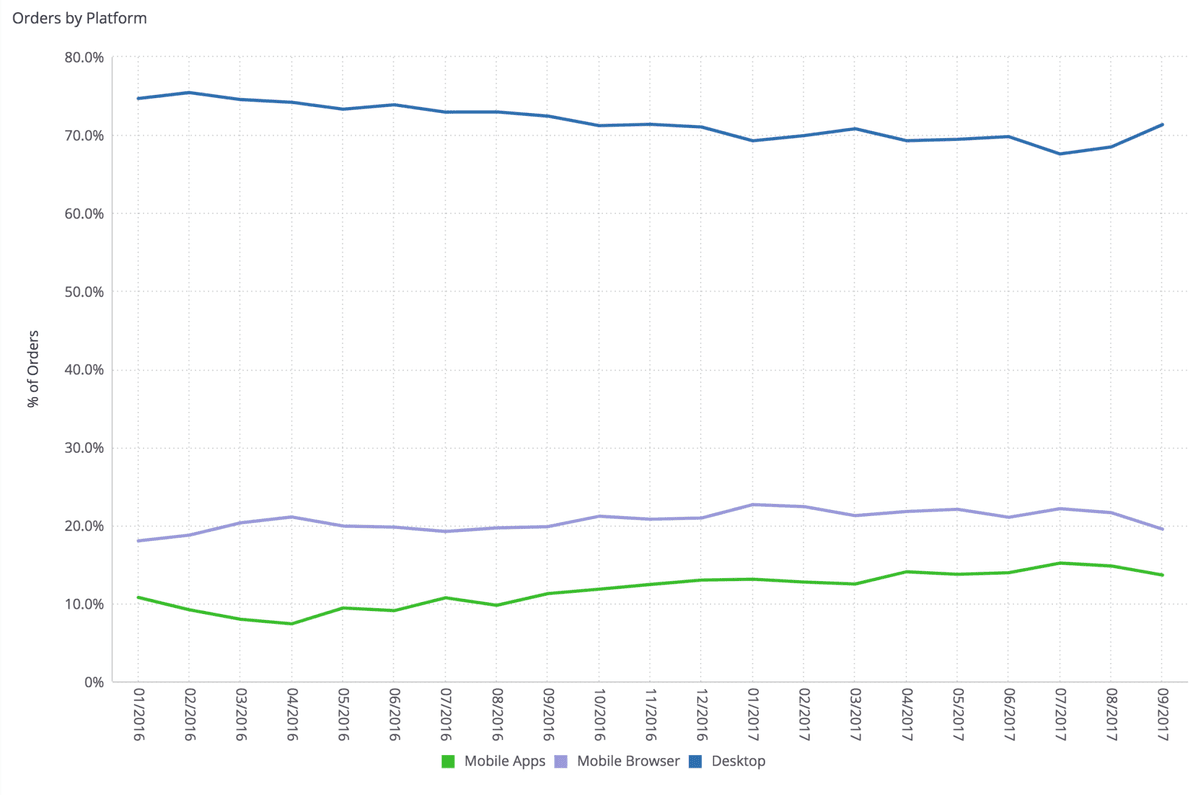
This report provides an overview of which digital platform customers use to place their orders.
- Orders by platform (Desktop, Mobile App, or Mobile Browser)
- Orders by all platforms – a detailed summary (i.e. Android, Android App, Chrome, Firefox, iOS App, Safari)
To learn more about how you can grow your bottom line by optimizing your online and in-store business with Rosie and Rosie Data Analytics, Please contact sales@rosieapp.com or call us today at 1-855-ROSIENOW (767-4366)
